
BIGML: explore data, find patterns and make predictions
Gepubliceerd: Auteur: Charalampos Sarantopoulos Categorie: Data Science“Will tools like BIGML or Google Prediction APIs put Machine Learning experts out of the job?” I found this question in a forum and incredibly enough has attracted much attention with many arguments. Although these services offer an easy way to apply machine learning methods and data analysis, I believe they serve more as a complementary tool for experts to do their jobs.
In order to see if and how they can assist anyone interested in data-driven applications, let’s dive into and uncover the full potentials of each platform. In recent blogs, we discussed our experience with the Amazon ML and the Google Prediction APIs. We now continue with a different platform, namely the BIGML, which is another way to explore the data, find interesting patterns and make predictions.
Let’s get started: set up the account
In this blog you can read step-by-step the procedure I followed starting from scratch. The BIGML platform has a very user-friendly environment, which can be seen from the very beginning while setting up the account. The process of signing-up takes literally 2 minutes and on top of that, the payment options are very flexible. Pay-as-you-go or subscription depending on the user’s requirements and a free usage of BIGML for tasks less than 16 MB!
Choose the dataset
The dataset I used is the banking dataset, which was also used for testing Amazon ML and Google prediction APIs. I chose this particular dataset because I would like to compare the results with the other platforms and also because of its nature. It contains an adequately enough number of attributes (i.e. 20), so that we can try out what BIGML is very proud of: correlation between the attributes, relations and descriptive statistics.
Upload data: many possibilities
BIGML offers many possibilities to upload the data. The cool thing about it is that someone can use his data that exist in his Dropbox, Google cloud, Microsoft Azure or in a S3 bucket in Amazon cloud. Also, it accepts zipped and of course simple csv files.
Once the data are uploaded, we are offered numerous possibilities. For example we can define the language (the default is set to auto-detected), the separator, the quote (i.e. ‘single’ or ‘double’), the missing tokens (i.e. one of the following: NaN, NULL, N/A, null, -, #REF!, #VALUE!, ?, #NULL!, #NUM!, #DIV/0, n/a, #NAME?, NIL, nil, na, #N/A, NA), the header (i.e. leave it out, pinpoint it or use smart detection). Also, for text analysis it offers tokenization, stemming, stop words removal etc.
In general, the data is nicely represented with the instances as rows and the fields as columns in a nice and friendly interface.
Access to relevant info and statistics
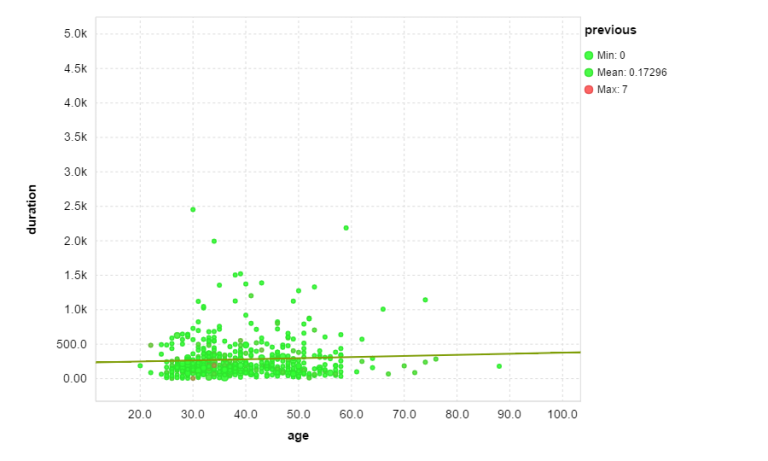
Here, BIGML makes a distinction between the origin of the data (the ‘source’) and the actual data that’s being used for training (the ‘dataset’). By clicking ‘1-click dataset’, we can create our dataset from the data source. By doing so, we have access to relevant info and statistics such as missing values, errors, histogram for every field showing the fluctuation etc. Even more specifically: we can create scatter plots for every two fields to observe their relation. Between the numeric-type fields we can see the correlation and apply a regression line just like in the following example.
Anomaly detection
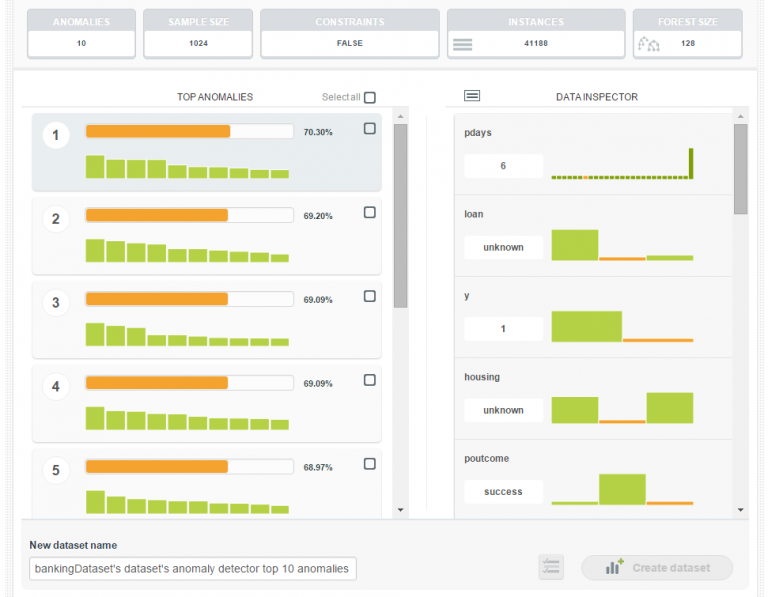
One feature that BIGML provides, is the anomaly detection. Initially, I was very happy but also curious to see it happening. They use the isolation forest algorithm to find the outliers in a dataset which is a fundamentally different approach (intrinsic properties of few and different). The idea of detecting anomalies was a nice feature to see incorporated in the platform. For example, below you can see the top 10 anomalies (instances that do not conform to a regular pattern) detected with their relative scores.
Great feature: clusters
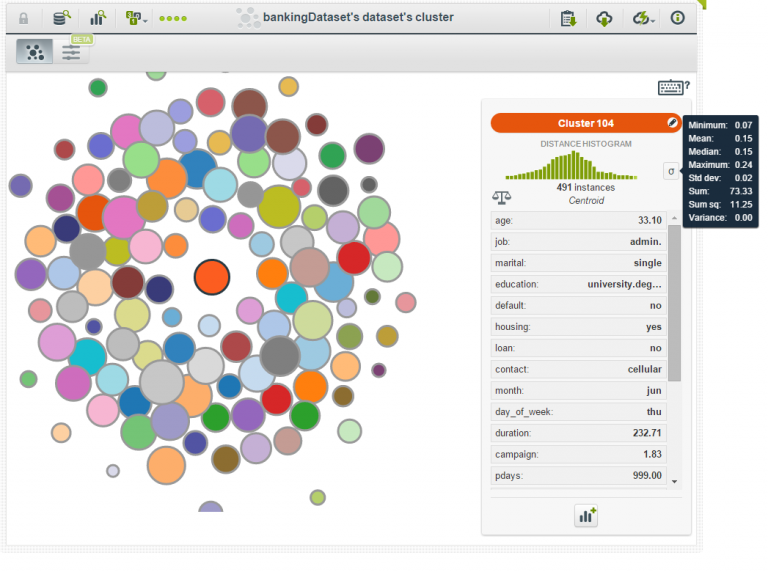
Another nice feature is the clusters that can be created from the data. With the option ‘1-click clusters’, the clusters are created and bounce on the screen which increases your perception of the interactivity. When clicking on a cluster, the statistics and the centroid are displayed, like in the following picture.
Create the model
After all these nice features, it was time to create the model. First we needed to split the dataset into training and test set. We did that by clicking the ‘1-click training-test set’. The dataset is split in 80:20 ratio with training set containing 32.950 instances and test set having 8.239. Then, we were ready to create the model. We did that by clicking the ‘1-click model’.
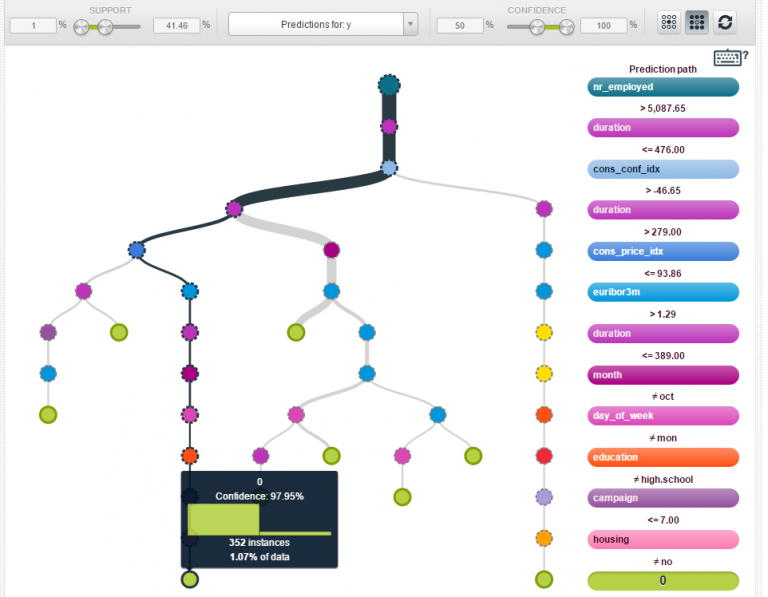
After some time, the model with a tree structure form appears. If we click on a node, the confidence and the the number of instances are shown (see the picture below). Apparently, we can change the confidence and support threshold to our preference. By doing so, we can explore different routes from root to leaf nodes. Interestingly, BIGML offers the possibility to show both rare interesting patterns (high confidence and less than 1% support), and frequent interesting patterns (high confidence and more than 1% support).
Making predictions
After the model is created, we can use it to make predictions. Predictions can be of two forms, either one at a time or batch predictions. Another very nice feature from BIGML is that you can create actionable models in many ways such as in Python, C, Tableau, excel and many more.
Out of curiosity, I picked the Excel format and ended up with an excel sheet filled with formulas whereby entering a value for each attribute, it generates the prediction based on the model we just created.
Model evaluation
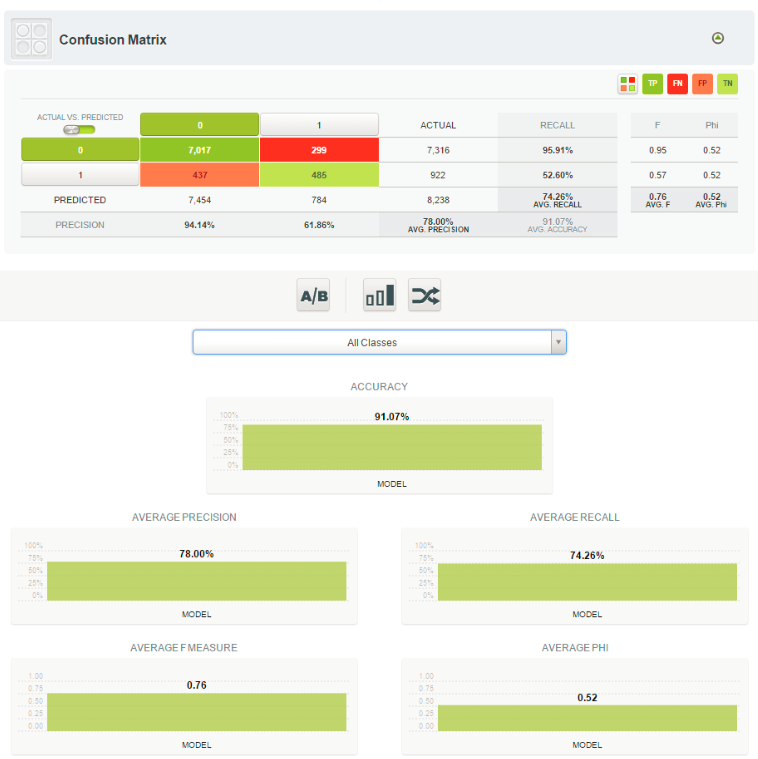
Finally, we needed to evaluate the model. The evaluation occurs in the 20% of the dataset. The accuracy is 91.07%. It also gives the precision, the recall, the F1 measure and Phi as shown below:
Most user-friendly interface
Now we’re finished, i can tell it’s the most user-friendly interface compared to the other platforms (i.e. Amazon and Google). Animation, guidance, minimal interface, interactive feeling and documentation make your life much easier.
Another remark has to do with the simplicity of uploading the data to the server. The most important element that differentiates BIGML from the other platforms, is the opportunity to transfer the dataset from other cloud services such as Amazon and Google. You can retrieve your data even from your Dropbox account. The simplicity of the procedure can be seen by the fact that a simple drag & drop suffices to upload your CSV file.
Moreover, some nice features that make it even more appealing are the anomaly detection and the clustering. Except for the nice representation of these features, it gives a good (first) insight on how the data is structured. Most important, anomaly detection can have many applications from fraud detection to sensor networks and system health monitoring.
Also, apart from the nice web interface from which you can go through the entire process, you can also call the corresponding APIs. BIGML has established connections with many languages like Java and Python and by calling the APIs, you can organize your data, define the parameters (cross validation, ratio of training-test set etc.), create the models, create your own clusters (e.g. define new centroids), make predictions etc.
Concern: the tree-oriented attitude
My concerns have to do with the tree-oriented attitude of BIGML. Although decision trees are very well understood, interpretable and scalable, they suffer from fragility and in general lack of robustness. No other models are embedded, while other platforms such as Google appears to test different models against one another.
On the other hand, BIGML is not a black box as its competitors. They use Random Decision Forest Ensembles, Bagging Ensembles, K-means Clustering *G-means Clustering* and Isolation Forest for anomaly detection.
Regarding time: it took me only a couple of hours until I get the final results, while I started from scratch. As far as the cost is concerned, BIGML offers free usage as long as each task is no bigger than 16MB in development mode. In that case, it is intended for scientific and experimental purposes. In different cases, you can pay as you go, or make a subscription, with standard, pro or advanced account, which seems like a good deal.
Moreover, logistic regression and association rules are two features that were announced by BIGML. It seems that they keep on adding extra features to make it even more powerful.
Overall: very surprised
I was surprised by the simplicity, functionality and the novelty of the services provided. The accuracy of the model with the banking dataset was 91.07%, which is slightly higher than that from Amazon and Google. And as Louis Dorard said: “In this wave of ML services, the giant tech companies are getting all the headlines, but bigger companies do not necessarily have better products”.


Where can you get the banking data set that corresponds to this blog? Very useful material! Thanks
Hi. Thank you for the article.
Do you have or know an example of ML tutorial with business logic. For example - modeling buying goods to support warehouse level ?
Thanks in advance.