
Oracle Fusion Middleware 12c – selective tracing
Gepubliceerd: Auteur: Michel Schildmeijer Categorie: Oracle[Deze blog is alleen in het Engels beschikbaar]
For doing a good diagnosis in case of a problem in your Oracle Fusion Middleware Product, the platform offers you many methods and techniques to do your investigation. The disadvantage from some of these methods is that they have some impact on your system, such as if you would raise the log or debuglevel or use diagnostic snapshots.
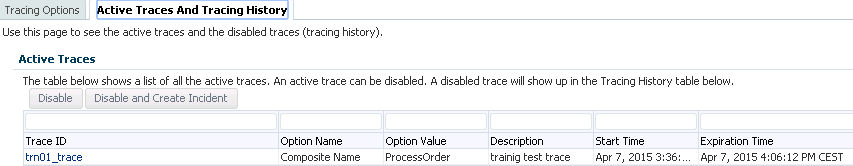
Your trace session will expire at the end of the specified duration or you may manually disable it in the ‘Active Traces and Tracing History’ tab by highlighting the session and clicking the ‘Disable’ button. If you should restart your managed server instance during the tracing session the session will be ended and must be recreated when the managed server instance is back up.
Run the composite for which the tracing session is enabled.
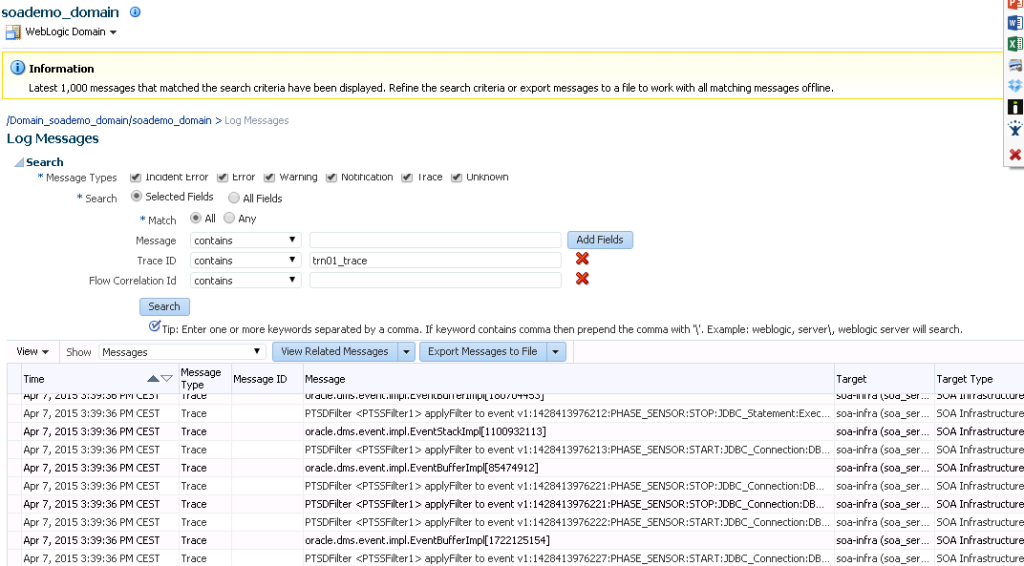
When the run is complete, success or failure, we have a couple of options to view the trace output. Since all of the trace entries are logged in the server diagnostic log, <server home>/logs/<server>_diagnostic.log, we can filter by the trace ID using your preferred editor, or by clicking on you trace event.
Each trace log entry is quite long. Below are some snippets of what to expect.
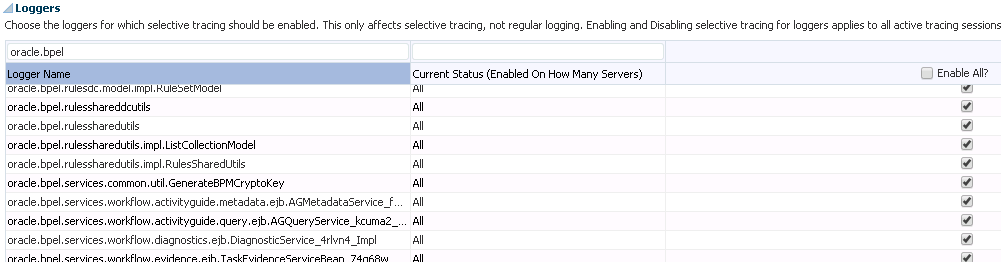
All loggers are enabled by default and there is the option to both sort by the available columns as well as search. Here we display only the loggers that contain the string ‘oracle.bpel’
Your Selective Tracing session is now configured and ready to be activated by clicking the ‘Start Tracing’ button. If all is well you will see the following confirmation message at the top of the screen:
- Set your trace level as desired, enter an optional description and specify a duration for the trace session. The default value is 30 minutes. We leave trace to FINEST
- You have two options for the Trace ID, a system generated alphanumeric value or a custom value that you choose. In this example we’re using a custom string, trn[nn]trace
You may select the loggers that you want to be active for your tracing session by expanding the ‘Loggers’ below the form.
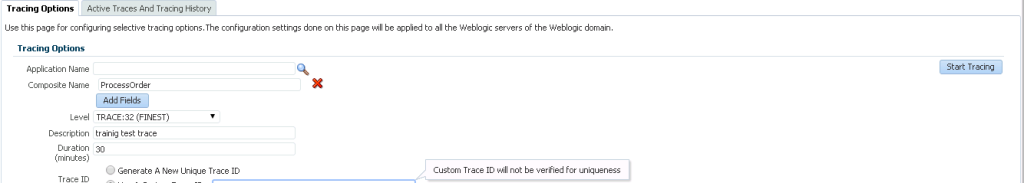
Select the ‘Option Name’ to choose the scope of your trace session. In this example we choose ‘Composite Name’ and enter the value in the text field.
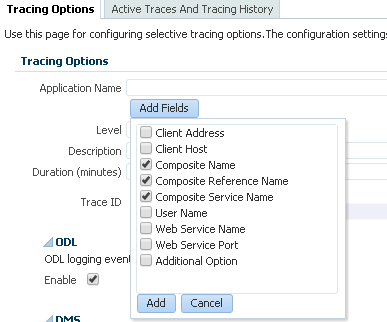
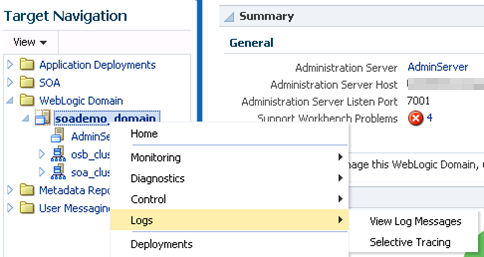
- Right click your domain name -> Logs -> Selective Tracing. This will bring you to the following screen where you can configure your Selective Tracing session. Click on add fields and select as below:
Selective Tracing is a facility available through Enterprise Manager to limit the scope of trace logging.This allows for debugging of a production system without overloading the system with logging activity. To use Selective Tracing, perform the following method:
- On the left expand ‘WebLogic Domain’
- Open Enterprise Manager: http://<your host>:7001/em
- Right click your domain name -> Logs -> Selective Tracing. This will bring you to the following screen where you can configure your Selective Tracing session. Click on add fields and select as below:
Select the ‘Option Name’ to choose the scope of your trace session. In this example we choose ‘Composite Name’ and enter the value in the text field.
- Set your trace level as desired, enter an optional description and specify a duration for the trace session. The default value is 30 minutes. We leave trace to FINEST
- You have two options for the Trace ID, a system generated alphanumeric value or a custom value that you choose. In this example we’re using a custom string, trn[nn]trace
You may select the loggers that you want to be active for your tracing session by expanding the ‘Loggers’ below the form.
All loggers are enabled by default and there is the option to both sort by the available columns as well as search. Here we display only the loggers that contain the string ‘oracle.bpel’
Your Selective Tracing session is now configured and ready to be activated by clicking the ‘Start Tracing’ button. If all is well you will see the following confirmation message at the top of the screen:
Run the composite for which the tracing session is enabled.
When the run is complete, success or failure, we have a couple of options to view the trace output. Since all of the trace entries are logged in the server diagnostic log, <server home>/logs/<server>_diagnostic.log, we can filter by the trace ID using your preferred editor, or by clicking on you trace event.
Each trace log entry is quite long. Below are some snippets of what to expect.
Your trace session will expire at the end of the specified duration or you may manually disable it in the ‘Active Traces and Tracing History’ tab by highlighting the session and clicking the ‘Disable’ button. If you should restart your managed server instance during the tracing session the session will be ended and must be recreated when the managed server instance is back up.


Can you please explain for BAM projects
Very Good Michel ! Thx.. :)